Portfolio Design #05: Monitoring & Analytics
Introduction
In my previous posts, I covered the API architecture and data layer of my portfolio and blog. This post focuses on monitoring and analytics: how I track application performance, traffic, and system health using Prometheus.
For this small blog, comprehensive monitoring might seem excessive. However, I wanted visibility into: - Performance: Are response times staying under 250ms? - Traffic patterns: Which posts are most popular? - System health: Is the server handling load? Are caches effective? - Operational insights: When should I scale? What’s causing slow responses?
The solution: Prometheus for metrics collection, with a custom admin dashboard that queries Prometheus to visualize the data.
Why Prometheus?
I chose Prometheus because it’s: - Open-source: No licensing costs (and I love OSS) - Pull-based: Prometheus scrapes metrics from endpoints, avoiding push complexity - Time-series optimized: Efficient storage and querying of metrics over time - Self-hosted: It can run alongside my application in Docker Compose, so no extra cloud service dependency
For a small blog, a managed service like Datadog or New Relic would be overkill (and expensive). While Datadog does have a free tier, its single-day metric retention wouldn’t help getting long-term insights on my website. Prometheus gave me the flexibility to monitor exactly what I need without vendor lock-in.
Metrics Collection Setup
Prometheus Configuration
Prometheus runs as a container and scrapes metrics from multiple sources:
scrape_configs:
  - job_name: 'api'
    scrape_interval: 15s
    static_configs:
      - targets: ['api:9091']
  - job_name: 'cadvisor'
    scrape_interval: 15s
    static_configs:
      - targets: ['cadvisor:8080']
  - job_name: 'node-exporter'
    scrape_interval: 15s
    static_configs:
      - targets: ['node-exporter:9100']
Scrape targets:
- api:9091: Application metrics (page views, cache hits, response times)
- cadvisor:8080: Container resource usage (CPU, memory, filesystem per container)
- node-exporter:9100: Host-level metrics (total memory, CPU cores)
A 15-second scrape interval provides granular data without overwhelming the system.
Metrics Endpoint
The app exposes metrics on a separate HTTP server (port 9091) using the Prometheus client library:
router.Get("/metrics", func(w http.ResponseWriter, r *http.Request) {
    promhttp.Handler().ServeHTTP(w, r)
})
This endpoint returns all registered Prometheus metrics. Prometheus scrapes this endpoint every 15 seconds and stores the time-series data.
Application Metrics
The application tracks four categories of metrics:
Page Views
Tracks every page request with labels for filtering:
pageViews = prometheus.NewCounterVec(
    prometheus.CounterOpts{
        Namespace: "portfolio",
        Name:      "page_views_total",
        Help:      "Total page views by page/post, status code, and bot detection.",
    },
    []string{"page", "slug", "status", "bot"},
)
Labels:
- page (5): “home”, “blog”, “post”, “404:post”, “404:other”
- slug (1 + N): Empty string for non-post pages, post slug for blog posts
- status (~10): HTTP status code (200, 404, 500, etc.) - technically up to 599, but realistically ~10 values
- bot (2): “true” or “false” (detected via User-Agent)
Recording:
func (h *PageHandlers) HandleHomePage(w http.ResponseWriter, r *http.Request) {
    start := time.Now()
    defer func() {
        if h.analytics != nil {
            h.analytics.RecordResponseTime(analytics.PageKeyHome, time.Since(start).Milliseconds())
            h.analytics.RecordReferrer(analytics.PageKeyHome, r.Header.Get("Referer"))
        }
    }()
    // ... handler logic ...
    h.analytics.IncrPageView(analytics.PageKeyHome, statusCode, r.UserAgent())
}
Bot detection uses the crawler-user-agents library to filter out crawler traffic from analytics.
Note: The bot field may be removed, since this insight is easy to get from Cloudflare metrics. Removing it would halve the cardinality and lessen library dependencies.
Cache Performance
Tracks cache hit/miss ratios for each cache bucket:
cacheReqs = prometheus.NewCounterVec(
    prometheus.CounterOpts{
        Namespace: "portfolio",
        Name:      "cache_requests_total",
        Help:      "Total cache requests by bucket and hit/miss result.",
    },
    []string{"bucket", "result"},
)
Labels:
- bucket (5): “profile”, “experience”, “post_list”, “post_by_slug”, “slug”
- result (2): “hit” or “miss”
This helps identify which caches are effective and which might need tuning.
Response Times
Tracks response latency using a histogram with custom buckets:
httpLatency = prometheus.NewHistogramVec(
    prometheus.HistogramOpts{
        Namespace: "portfolio",
        Name:      "http_duration_seconds",
        Help:      "HTTP handler duration in seconds by page/post.",
        Buckets:   []float64{0.05, 0.10, 0.25, 0.50, 1.0}, // >= 1s == +inf
    },
    []string{"page", "slug"},
)
Buckets (6): <50ms, <100ms, <250ms, <500ms, <1s, >=1s
Labels:
- page (5): “home”, “blog”, “post”, “404:post”, “404:other”
- slug (1 + N): Empty string for non-post pages, post slug for blog posts
Note: Each label combination creates 8 time series: 6 _bucket series (one per bucket with le label), plus _sum and _count series.
These buckets align with my performance goals (sub-250ms target) and help identify slow pages.
Referrers
Tracks traffic sources by categorizing referrer headers:
referrers = prometheus.NewCounterVec(
    prometheus.CounterOpts{
        Namespace: "portfolio",
        Name:      "referrers_total",
        Help:      "Referrer category counts by page/post.",
    },
    []string{"category", "page", "slug"},
)
Labels:
- category (4): “direct”, “search” (Google, Bing, etc.), “social” (Twitter, LinkedIn, etc.), “other”
- page (5): “home”, “blog”, “post”, “404:post”, “404:other”
- slug (1 + N): Empty string for non-post pages, post slug for blog posts
This provides insights into how visitors discover the blog.
Note: While I would have preferred more granular insights on which referrer led here, each additional referrer would have increased cardinality.
Dashboard Queries
The admin dashboard queries Prometheus using PromQL to aggregate metrics for admin page visualization. These queries use metrics from cAdvisor (container metrics) and node-exporter (host metrics), which Prometheus scrapes alongside application metrics.
Here are the key queries:
Total Views (Human Traffic Only)
sum(increase(portfolio_page_views_total{bot="false"}[7d]))
Uses increase() to calculate the total increase over a 7-day window, filtering out bot traffic.
Top Posts
topk(5, sum by (slug) (increase(portfolio_page_views_total{page="post", bot="false"}[7d])))
Aggregates views by slug, then selects the top 5 posts.
Cache Hit Ratio
sum(increase(portfolio_cache_requests_total{result="hit"}[24h]))
/
sum(increase(portfolio_cache_requests_total[24h])) * 100
Calculates the percentage of cache hits over the last 24 hours.
Response Time Distribution
sum by (le) (increase(portfolio_http_duration_seconds_bucket[7d]))
Histogram buckets are exposed as separate time series with a le (less than or equal) label. This query aggregates all buckets to show the distribution of response times.
Views Over Time
sum(increase(portfolio_page_views_total{bot="false"}[1d]))
Used with query_range to get time-series data. The increase() function calculates the increase over a 1-day window at each step, providing daily view counts.
Status Code Breakdown
sum by (status) (increase(portfolio_page_views_total{bot="false"}[7d]))
Groups page views by HTTP status code to identify errors (404s, 500s, etc.).
Resource Monitoring
Aside from application metrics, the dashboard also displays container resource usage. For these metrics, I set up the cAdvisor and node-exporter containers.
CPU Usage
sum(rate(container_cpu_usage_seconds_total{name=~".+"}[1m])) by (name)
/
count(node_cpu_seconds_total{mode="idle"}) * 100
Calculates CPU usage as a percentage by: 1. Getting the rate of CPU usage per container over 1 minute 2. Dividing by the total number of CPU cores 3. Converting to percentage
Memory Usage
sum(container_memory_working_set_bytes{name=~".+"}) by (name)
/
node_memory_MemTotal_bytes * 100
This calculates memory usage percentage per container. I’m tracking container_memory_working_set_bytes instead of container_memory_usage_bytes, because:
You might think that memory utilization is easily tracked with container_memory_usage_bytes, however, this metric also includes cached (think filesystem cache) items that can be evicted under memory pressure. The better metric is container_memory_working_set_bytes as this is what the OOM killer is watching for. - Bob Cotton
Storage Usage
avg_over_time(container_fs_usage_bytes{name=~".+"}[1m])
Tracks filesystem usage per container over time.
Cardinality Considerations
Prometheus stores each unique combination of metric name and label values as a separate time series. High cardinality (many unique label combinations) increases memory usage and query time.
Estimated Cardinality
For my blog with ~100 posts:
| Metric | Base | Per-Post | Total |
|---|---|---|---|
| page_views_total | 80 | 20 | 80 + 20N |
| cache_requests_total | 10 | 0 (fixed) | 10 (fixed) |
| referrers_total | 16 | 4 | 16 + 4N |
| http_duration_seconds | 32 | 8 | 32 + 8N |
| Total | 138 | 32 | 138 + 32N |
Base: Fixed time series that exist regardless of post count (non-post pages with empty slug).
Per-Post: Additional time series added for each blog post (post pages with unique slug).
Total: Base + (Per-Post * N), where N is the number of posts.
For 100 posts: ~3,338 time series (138 + 32 * 100)
Memory estimate: ~29 MiB total (based on robustperception calculator). This is the steady-state memory usage after the retention period is full. Memory grows as data accumulates during the first 7 days, then stabilizes.
Storage estimate: ~65 MiB/day using 15-second scrape intervals. With 7-day retention, storage stabilizes at ~455 MiB (7 days * 65 MiB/day). Prometheus automatically deletes data older than 7 days, so storage doesn’t grow indefinitely - it maintains a rolling 7-day window.
With a 7-day retention and 5GB limit, this is well within acceptable bounds for a small blog.
Managing Cardinality
The biggest risk factor is the slug label on post metrics, which grows unbounded with the number of posts. For now, this is acceptable since:
- Post count grows slowly (~1 per week)
- Each post adds a fixed number of time series
- Memory/storage impact is predictable
Dashboard Implementation
The admin dashboard (/admin/analytics) queries Prometheus via its HTTP API.
type PromClient struct {
    baseURL    string  // e.g., "http://prometheus:9090" for local prom
    httpClient *http.Client
}

func (prom *PromClient) queryVector(ctx context.Context, q string) ([]sample, error) {
    u, err := url.Parse(prom.baseURL)
    u.Path = "/api/v1/query" // Prometheus HTTP API endpoint
    v := u.Query()
    v.Set("query", q) // PromQL query as URL parameter
    u.RawQuery = v.Encode()

    resp, err := prom.httpClient.Do(req)
    // ... parse Prometheus JSON response ...
}
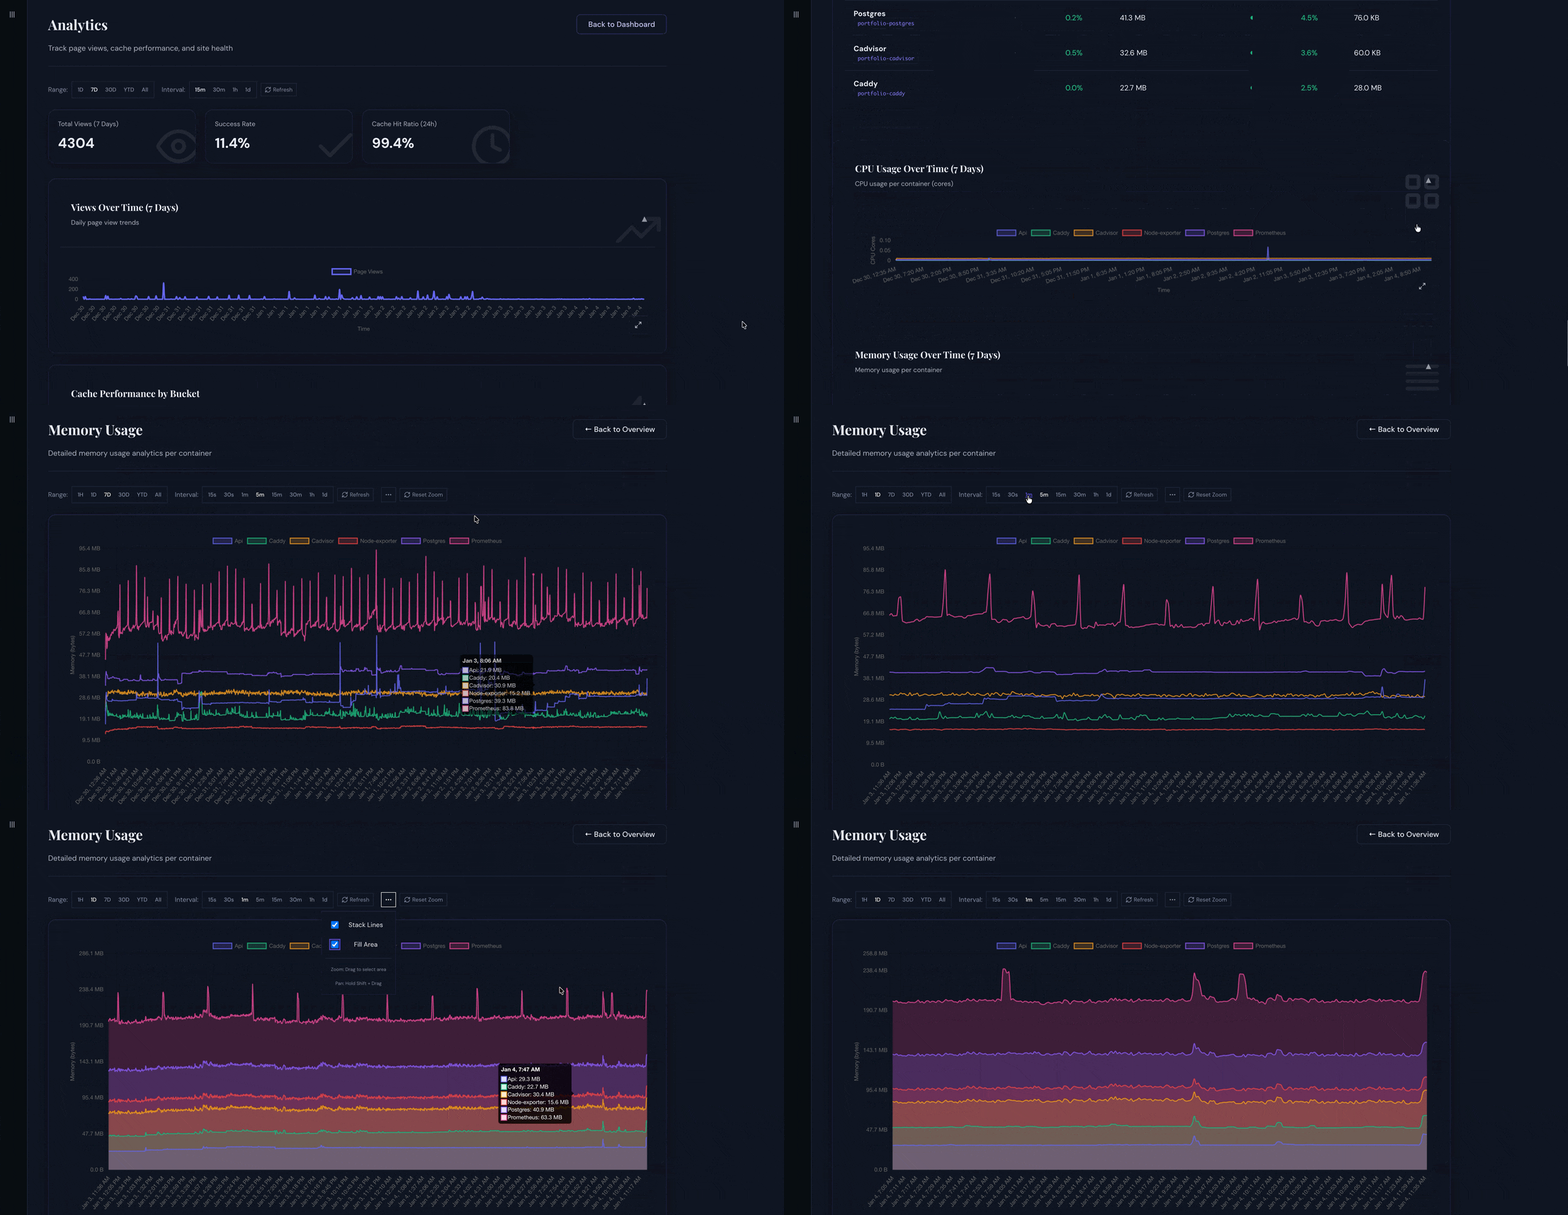
The dashboard supports time range selection and aggregation intervals as options.
All queries are executed on-demand when the dashboard loads, with results rendered using Chart.js for visualization.
Conclusion
Prometheus provides a lightweight, self-hosted solution for monitoring my blog. With application metrics and system metrics, I have full weekly visibility into both traffic and system health.
In the final post, I’ll quickly cover the operational side: deployment and GitOps workflows.